
Tuesday, December 23, 2014
Nifty Dec 22, 2014
Today seems to be a turning point..Will Nifty reverse on Dec 23?
Then the next important date is Jan 01/02....

Then the next important date is Jan 01/02....
Monday, December 22, 2014
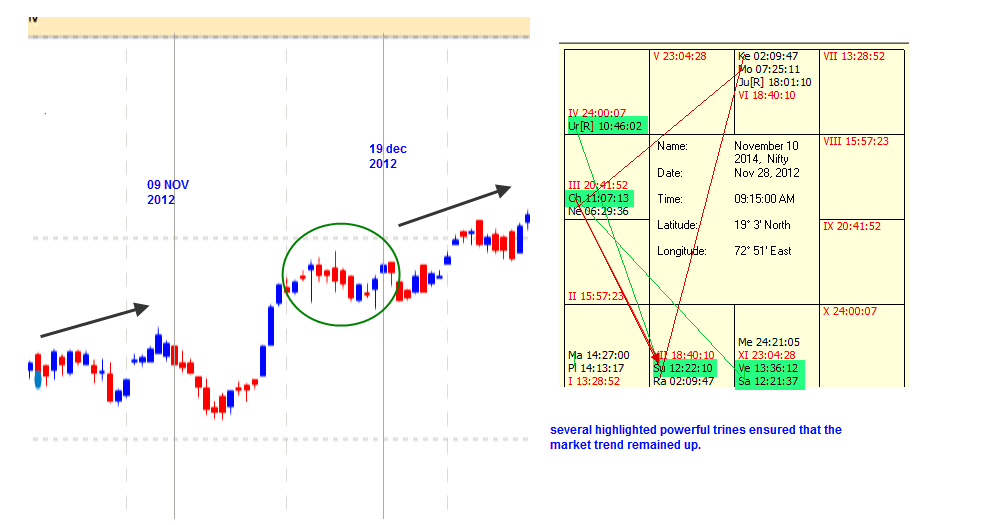
Bank Nifty Astro Chart
This is the astro chart of Bank Nifty.Favourable planets are marked in Green and unfavourable in red. 
This chart below shows the dasa positions of Bank Nifty during the various highs and lows in 2014.Dasa lord Venus, is also the Lagna star lord. He is favourably placed in the sixth. So even if Bank Nifty reacts to unfavorable aspects ( which are Universal and which is also why various markets in different geographic and time zones still seem to react in tandem), Bank Nifty is exhibiting relative strength compared to Nifty.

Sunday, December 21, 2014
Nifty Astro Technicals Dec 22 to 26, 2014
Last week we did comment that any bounce if it happens, it could be the result of Sun trine Jupiter.Nifty and the world markets bounced from their lows, the reason this time was that Fed declared it would be "patient" with respect to interest rate increases.We had also expected 8300 or 8350 to be first level targets.
Sun and Jupiter were trine on December 15, 2014. By December 17, we saw Nifty bouncing from a bottom of 7961.This was the last aspect involving Jupiter. Hereafter Uranus aspects take over.
On December 22, Uranus turns direct.It continues to be in close square with Pluto.Meanwhile Venus starts squaring with Uranus and conjunct Pluto. It will also start squaring Rahu and Ketu.
On December 23, we see Moon also joining the Rahu Venus Ketu trio. Also Rahu forms a trine with Mars.
On December 24 to 26, Mercury starts becoming conjunct with Pluto and square Rahu and Uranus.
On December 27, Moon joins with Uranus and becomes a powerful translator of Uranian energy.
On January 02, 2015, Mars begins to oppose Jupiter retro.
On January 04, 2015, Sun conjuncts Pluto and squares Uranus, Ketu as well as Rahu.
This means we are in for a heavily energised period.
Since Uranus is involved we may expect sudden high movements upward and also reversals downward.Extreme care is required in the markets now.
We might see a reversal to form another bottom and then market rising into the New Year.

Dasa wise,
 Venus moves out from 5th house to 6th house. She showed a positive upmove from 7961.Now since Sun also is in 5th house when the sub period starts and moves on to 6th house, we may expect another upmove to start by December 26th.
Technically,
we are in wave b of a of b which had started from the low of 7961. 50% retracement level comes to 8292.This is a critical level. Nifty could turn down again from this level.another attempt at a bottom cannot be ruled out.Remember, we are in the corrective phase of the upmove from 7724 to 8627 and the near term has not fully turned positive yet. Sustenance above 8292 is a must. Since the down move from 8627 has nearly come down by 80% we need to take this upmove only with caution.
Another factor is the momentum charts.Reverse divergence has been seen in the daily charts, but keep an eye on the weekly charts as well.


Sun and Jupiter were trine on December 15, 2014. By December 17, we saw Nifty bouncing from a bottom of 7961.This was the last aspect involving Jupiter. Hereafter Uranus aspects take over.
On December 22, Uranus turns direct.It continues to be in close square with Pluto.Meanwhile Venus starts squaring with Uranus and conjunct Pluto. It will also start squaring Rahu and Ketu.
On December 23, we see Moon also joining the Rahu Venus Ketu trio. Also Rahu forms a trine with Mars.
On December 24 to 26, Mercury starts becoming conjunct with Pluto and square Rahu and Uranus.
On December 27, Moon joins with Uranus and becomes a powerful translator of Uranian energy.
On January 02, 2015, Mars begins to oppose Jupiter retro.
On January 04, 2015, Sun conjuncts Pluto and squares Uranus, Ketu as well as Rahu.
This means we are in for a heavily energised period.
Since Uranus is involved we may expect sudden high movements upward and also reversals downward.Extreme care is required in the markets now.
We might see a reversal to form another bottom and then market rising into the New Year.
Dasa wise,
Technically,
we are in wave b of a of b which had started from the low of 7961. 50% retracement level comes to 8292.This is a critical level. Nifty could turn down again from this level.another attempt at a bottom cannot be ruled out.Remember, we are in the corrective phase of the upmove from 7724 to 8627 and the near term has not fully turned positive yet. Sustenance above 8292 is a must. Since the down move from 8627 has nearly come down by 80% we need to take this upmove only with caution.
Another factor is the momentum charts.Reverse divergence has been seen in the daily charts, but keep an eye on the weekly charts as well.
Despite all the hungama,it has still not bottomed out. This could be a crucial week from that angle. Once Weekly bottoms out, we can expect a sustained recovery or upmove.
Trade carefully.Year end is approaching. It had been a great year from an investment and trading perspective.Let us strive to complete this year on a very happy and positive note.
Thursday, December 18, 2014
December 18, Nifty Technicals
Overnight global cues look good, but the dollar has breached 89...so play it safely..Look to the overhead Fibo clusters..they may offer resistance. If they are taken out, we have a short term up move on our hands. Weekly is still down, so caution is advocated.
8175 8189 are important levels to watch.7904 is the floor, being 80% of the upmove from 7724.

Sunday, December 14, 2014
Nifty Astro Outlook December 15 to 19, 2014
Another aspect, in fact the last of the Jupiterean aspects for a while, is Sun trine with Jupiter. Since both are in Mercury stars, the effect may not be very large.
This means the negative energy of Pluto square Uranus, retro Jupiter and after effects of Sun conjunct Mercury..should dominate this week. If any bounce happens it could be the Sun Jupiter trine in play, but I do not expect it to be very high..

By the weekend, Venus squares Uranus and conjuncts Pluto. This is a powerful, impactful event which should manifest as an upmove in a falling market, but with a lag.Since, by December 23, Venus squares Rahu, Moon squares Rahu and Mars trines Rahu, we may expect a good improvement in the period just after December 24. In other words, let us not carry shorts post Christmas !
Nifty Astro Technicals December 15 to 19, 2014
Let me begin by recalling the comments of last week....
"Astro wise we see the market is in a mature stage right now.Sun Mercury dance has now started spinning in the wrong way.Big rises normally caused by a Uranus Pluto square seems muted because of the Jupiter retro formation in between.The stars seem to advise caution to the bulls and have a hint of a smile for bears.Since Saturn is in Scorpio, the underlying tone of the market may continue to be bullish,but a correction may happen."
Well, it was timely wasn't it? From a high of 8546, Nifty nose dived to a low of 8216, before closing at 8224.What is more When Dow crashed from 17991 to 17281, when other world markets corrected hard and when Oil came down to $62.54,anxiety became panic driven...
So what do we expect next....
Let us start with the monthly charts of Nifty first...
 We are either in Wave F of the diametric which started from January 2008, or ABCDE correction had ended at 5119 and we are in an impulse upmove in which wave 3 is about to mature..If we consider wave F Is in progress, then wave F is a complex corrective involving two x waves in lower time frames. Currently we are in wave b of the 2nd-xabc formation. Accordingly after this wave b down, we will have one more wave c upwards, which will complete wave F in the monthly scale. Thereafter we should be seeing wave G downwards, which should consume the whole of 2015 and bring down Nifty to 7300 levels or even lower.
On the other hand if Nifty is in the 3rd wave and if it completes soon, then the 4th wave should be a complex corrective down which also comes down to the 7000+ levels.
After that Nifty may move up rapidly in 2016 and touch 10400-500 levels completing the trend cylce which began in 2008 October.It is possible that wave 4 or b wave of wave G assume bullish tones closer to the budget, appearing as if impulse push is on in the market. That will become clearer only closer to the budget..
So investors should offload their holdings in every rise, booking profits between now and the budget period.
 Just look at the monthly momentum charts..It is in a very high 95 levels. It is showing tendencies of a down move. Even a small move could shave off 1000 to 2000 points..So caution is what the chart is flashing...
Within the monthly, we move to weekly charts...
What do we see? 8180 was an important level of trend maturity.Now at 8224, Nifty is very close to 8180. If it sustains at this level and moves up, then we will be in another uptrend.On the other hand, if Nifty breaks this level now, then we shall see much lower levels starting from 7800 first.Parallel 45 degree levels may act as supports if such a thing happens.

Let us look at the momentum charts to understand better....Most of the understandings from here on apply for traders more rather than investors...The chart is self explanatory...
 So immediately we may see some bounce in the Nifty...in the smaller time frames, but that may only flatter to deceive.
Let us go down even further,,,to daily cycles:Our observation of the previous week are reproduced, along with new observations in black.
 Current 108 day cycle is a right translated cycle. Both the 108 day and the 23 day cycles are slated to bottom out in the December 24- 29 day period. This could also be a little advanced to December 19 or 22.So an important bottom should happen in the period mentioned above.The next cycle should start violently bullish, but may form a top closer to this bottom and start declining. In other words, the next cycle could be left translated.
What does this mean?
Whatever bounce which happens is an opportunity to go short..When the cycle bottoms out, in December 22-29 period, then we will get an opportunity to go long as well..
Going one more degree lower, to 30 min, we see that 8175-80 level seems to be an important support level from angles points also.

To conclude;Longer time frames are indicating caution. Weakness has started to creep into the market.Lower time frames are indicating some bounce is on the way.Use them by all means, for trading.but with tight stop losses.Right now the path of least resistance for the market, is down.Always keep this in mind when taking positions.
Astro discussions shall follow in another post.
Have a happy, yet safe trading!
Of course, all of this is my view point. I shall not be responsible for any trades which anyone does based on these information.Please contact your investment advisor before committing to the market.All information in this blog is for educative purposes only.
"Astro wise we see the market is in a mature stage right now.Sun Mercury dance has now started spinning in the wrong way.Big rises normally caused by a Uranus Pluto square seems muted because of the Jupiter retro formation in between.The stars seem to advise caution to the bulls and have a hint of a smile for bears.Since Saturn is in Scorpio, the underlying tone of the market may continue to be bullish,but a correction may happen."
Well, it was timely wasn't it? From a high of 8546, Nifty nose dived to a low of 8216, before closing at 8224.What is more When Dow crashed from 17991 to 17281, when other world markets corrected hard and when Oil came down to $62.54,anxiety became panic driven...
So what do we expect next....
Let us start with the monthly charts of Nifty first...
On the other hand if Nifty is in the 3rd wave and if it completes soon, then the 4th wave should be a complex corrective down which also comes down to the 7000+ levels.
After that Nifty may move up rapidly in 2016 and touch 10400-500 levels completing the trend cylce which began in 2008 October.It is possible that wave 4 or b wave of wave G assume bullish tones closer to the budget, appearing as if impulse push is on in the market. That will become clearer only closer to the budget..
So investors should offload their holdings in every rise, booking profits between now and the budget period.
Within the monthly, we move to weekly charts...
What do we see? 8180 was an important level of trend maturity.Now at 8224, Nifty is very close to 8180. If it sustains at this level and moves up, then we will be in another uptrend.On the other hand, if Nifty breaks this level now, then we shall see much lower levels starting from 7800 first.Parallel 45 degree levels may act as supports if such a thing happens.

Let us look at the momentum charts to understand better....Most of the understandings from here on apply for traders more rather than investors...The chart is self explanatory...
Let us go down even further,,,to daily cycles:Our observation of the previous week are reproduced, along with new observations in black.
What does this mean?
Whatever bounce which happens is an opportunity to go short..When the cycle bottoms out, in December 22-29 period, then we will get an opportunity to go long as well..
Going one more degree lower, to 30 min, we see that 8175-80 level seems to be an important support level from angles points also.
To conclude;Longer time frames are indicating caution. Weakness has started to creep into the market.Lower time frames are indicating some bounce is on the way.Use them by all means, for trading.but with tight stop losses.Right now the path of least resistance for the market, is down.Always keep this in mind when taking positions.
Astro discussions shall follow in another post.
Have a happy, yet safe trading!
Of course, all of this is my view point. I shall not be responsible for any trades which anyone does based on these information.Please contact your investment advisor before committing to the market.All information in this blog is for educative purposes only.
Monday, December 8, 2014

Sunday, December 7, 2014
Sun Mercury dance beginning in the second half of the year.
During the last three months of the year, Mercury goes retro, then becomes direct, conjuncts the Sun goes past the Sun and again becomes retrograde. This of late has been happening in the region Virgo to Aquarius..Here is a small analysis to throw some light on the effect on Nifty because of this astro phenomenon.


So Sun-Mercury conjunction of this type where Mercury comes from behind and conjuncts Sun, we seem to see a market reaction.
December 08, is one such conjunction....
Nifty Astro Technicals December 08 to 12, 2014
Let us start with the Astro formations first....


Astro wise we see the market is in a mature stage right now.Sun Mercury dance has now started spinning in the wrong way.Big rises normally caused by a Uranus Pluto square seems muted because of the Jupiter retro formation in between.The stars seem to advise caution to the bulls and have a hint of a smile for bears.Since Saturn is in Scorpio, the underlying tone of the market may continue to be bullish,but a correction may happen.
How about the cycles? Well, we have had another inversion happening and so a top somewhere between December 08 and 20 seems to be on the cards..However since the current cycle has formed a right translation so far, the next cycle post December 24 could also be bullish and take Nifty to new heights.
Looking at Neo waves, either wave a of 2nd xabc has been completed as of December 05 or there is a possibility of one more small up leg pending. Any which way, we seem to be on the verge of a small term top.
Nifty`s 5 min says that we just have to decide whether the final sub wave seen now is going to be wave g of a Diametric or wave e of a triangle. Again the upward move seems to be capped.
If wave a is over, then we may see wave b down, from the 2nd x abc formation and finally wave c upwards. Since in any complex correction only 2 x waves are allowed, we may see a bigger top and a bigger correction in the first few months of 2015.
Cautious and profitable trading to all!
Thursday, December 4, 2014
Hi friends,
Thank you for the mails you all have sent asking to be included in the blog reading list. I shall do the needful. As mentioned earlier, this blog shall be public till December 09, 2014 and thereafter it would become closed.
I intend to continue with my articles on Astro and Technicals, only difference it shall be available only to a select few who are members of this blog.
Meantime, here is an update on Nifty hourly and 5 min.
Please refer the hourly chart posted on November 24, 2014, in the following link.
http://niftyastrotechnicals.blogspot.in/2014/11/nifty-astro-technicals-for-november-24.html
I have reproduced an update of the very same chart here...

On Nov 24 itself, we had expected a double top around 8600+. Nifty subsequently went up to 8613 before retreating.A similar up move of e leg coming closer to 8600 could happen, before wave a of 2nd abbc comes to an end.After that a faster retracement, breaking the b-d line at around 8500 could be the confirmation that wave b downward has commenced, in the 2nd-abc series.
Please see the 5 min chart for elaborate wave counts...

Astrologically, the next big event is Jupiter is turning retrograde on December 09, 2014.After that it is the Uranus Pluto square on December 15th, 2014.Both these events normally match and join hands in producing a top formation. So get ready to sell off expensive stocks and the index, next week onwards.
Thank you for the mails you all have sent asking to be included in the blog reading list. I shall do the needful. As mentioned earlier, this blog shall be public till December 09, 2014 and thereafter it would become closed.
I intend to continue with my articles on Astro and Technicals, only difference it shall be available only to a select few who are members of this blog.
Meantime, here is an update on Nifty hourly and 5 min.
Please refer the hourly chart posted on November 24, 2014, in the following link.
http://niftyastrotechnicals.blogspot.in/2014/11/nifty-astro-technicals-for-november-24.html
I have reproduced an update of the very same chart here...
On Nov 24 itself, we had expected a double top around 8600+. Nifty subsequently went up to 8613 before retreating.A similar up move of e leg coming closer to 8600 could happen, before wave a of 2nd abbc comes to an end.After that a faster retracement, breaking the b-d line at around 8500 could be the confirmation that wave b downward has commenced, in the 2nd-abc series.
Please see the 5 min chart for elaborate wave counts...
Astrologically, the next big event is Jupiter is turning retrograde on December 09, 2014.After that it is the Uranus Pluto square on December 15th, 2014.Both these events normally match and join hands in producing a top formation. So get ready to sell off expensive stocks and the index, next week onwards.
Monday, December 1, 2014
Dear Friends,
Please read the article in the link given below.
To be a research analyst and to publish articles for public consumption, I need to be registered with SEBI.
Till date my studies and opinions were offered to all and sundry, free of cost. I had never sent any unsolicited mails or smses.
My articles were my own and done after painstaking work.
Still I do not have any SEBI registration as of date. While Iam planning for it soon, Iam constrained to also inform you that I shall be modifying this blog from an "open" one to a "closed" one, from December 09, 2014 onwards.
If you wish to be included in the reading list, please send me a mail to tekkiesuresh@gmail.com.The blog shall be open till December 09, 2014.
MUMBAI: To safeguard investors from misleading advice coming from unregulated entities, a new set of regulations for research analysts in capital markets would come into effect from Monday.December 01, 2014
Announcing these new regulations -- which would be a first in India -- Sebi said no person or entity would be allowed to act as research analyst or research entity without obtaining a certificate of registration from it under these regulations.
The ..
Sunday, November 30, 2014
Nifty Astro Technicals Dec 01 to 05, 2014
Last week we suggested that the market is bullish and not to short anything. True to our expectations, Nifty went on to surpass 8600 before closing at 8588.
We also surmised that the Uranus Pluto square is inexorably pulling up prices and with this square very much in formation, there is no question of any correction. This despite several negative set ups from short term planets.
But now the short term planets are beginning to turn positive as well.
On November 26, Uranus trined Venus.
By December 01, This Venus will trine Ketu also.
And by December 05, Venus will trine Jupiter, which has slowed down considerably, in preparation to its yearly retrograde motion.On the same day, Sun will trine with Uranus, another powerful combination.
By December 09, Sun will conjunct with Mercury and Jupiter will turn retrograde.This will be the first indication that the trend is fast maturing.
And of course we have Pluto Uranus square on December 15th.
So the short term planets also join in the positivity..
Trend continues to be up and from December 08 onwards, we have reasons to be cautious about..
Nifty daily cycles also agree..Cycle on Nov 21, was an inversion. So the cycle at December 24 will most probably produce a bottom. Red cycle of 108 days has been hugely right translated. So we expect a top somewhere between December 15 and 24, most probably by December 19/20.Since the current cycle was so right oriented, we expect a shallow correction for about 4 to 5 days and then the next upmove should resume again.


Meanwhile the last month of the year is just about to flower...Markets are cheerful..they may become exuberant at any moment!
So happy and safe trading.
We also surmised that the Uranus Pluto square is inexorably pulling up prices and with this square very much in formation, there is no question of any correction. This despite several negative set ups from short term planets.
But now the short term planets are beginning to turn positive as well.
On November 26, Uranus trined Venus.
By December 01, This Venus will trine Ketu also.
And by December 05, Venus will trine Jupiter, which has slowed down considerably, in preparation to its yearly retrograde motion.On the same day, Sun will trine with Uranus, another powerful combination.
By December 09, Sun will conjunct with Mercury and Jupiter will turn retrograde.This will be the first indication that the trend is fast maturing.
And of course we have Pluto Uranus square on December 15th.
So the short term planets also join in the positivity..
Trend continues to be up and from December 08 onwards, we have reasons to be cautious about..
Nifty daily cycles also agree..Cycle on Nov 21, was an inversion. So the cycle at December 24 will most probably produce a bottom. Red cycle of 108 days has been hugely right translated. So we expect a top somewhere between December 15 and 24, most probably by December 19/20.Since the current cycle was so right oriented, we expect a shallow correction for about 4 to 5 days and then the next upmove should resume again.
We can see how Neo waves also agree.Currently we are in wave 3 of wave 5 of wave c which is the last leg of wave a of the 2nd x abc combination.So after this wave a of xabc ends, then b of xabc should open downwards.Cycle s2(po) has now commenced on the hourly charts.Since there are only 2 x waves allowed in a complex correction Wave F should end when the current, 2nd xabc ends. That should be in the first quarter of 2015. However, since the markets have run up so much, we should be prepared for any aleration or deviation.
Meanwhile the last month of the year is just about to flower...Markets are cheerful..they may become exuberant at any moment!
So happy and safe trading.
Thursday, November 27, 2014


Astro Technicals of Dow Jones
Dow Jones, one of the oldest of indices is a good barometer of the US Financial Markets and a strong fore runner for other financial markets of the world.
Here are some charts of Dow Jones...
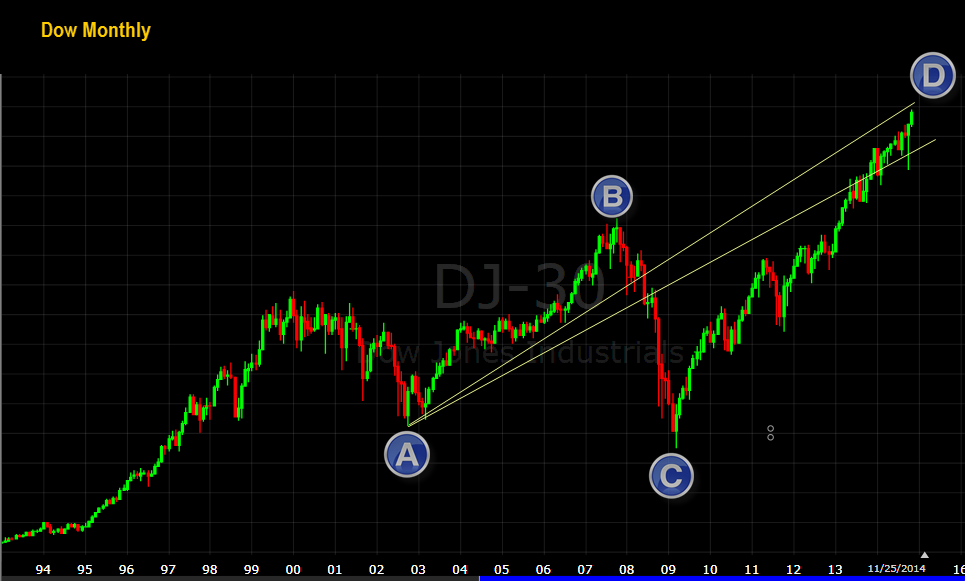
On a monthly scale, Dow has been correcting since 2000.It is currently in the D leg of what looks to be a huge diametric. If it is going to be a diametric, we may see three smaller legs, E down, F up and G down, before the pattern is completed.D leg is close to topping out and we could see a good down move in the form of E. But E may not be as severe as wave C.This may happen in the first or second quarter of 2015.

If we shift to a weekly basis,expand the chart and look at the developing wave D closely, we see that it a double diametric so far, connected by an x wave. Since it is perfectly channeling, this is not an impulse wave.Currently we are in wave g, which may top out around 18000. After that either wave E down could start or we may have another x-abc development inside the channel itself, before the top out occurs. Latter option seems to be more plausible as of now.At the time of this article, Dow is around 17800.
Here is an angular chart...

18000 seems to be the immediate top resistance, after which the move could continue with ups and downs till 22000, sometime in 2016.
Here are some charts of Dow Jones...

On a monthly scale, Dow has been correcting since 2000.It is currently in the D leg of what looks to be a huge diametric. If it is going to be a diametric, we may see three smaller legs, E down, F up and G down, before the pattern is completed.D leg is close to topping out and we could see a good down move in the form of E. But E may not be as severe as wave C.This may happen in the first or second quarter of 2015.
If we shift to a weekly basis,expand the chart and look at the developing wave D closely, we see that it a double diametric so far, connected by an x wave. Since it is perfectly channeling, this is not an impulse wave.Currently we are in wave g, which may top out around 18000. After that either wave E down could start or we may have another x-abc development inside the channel itself, before the top out occurs. Latter option seems to be more plausible as of now.At the time of this article, Dow is around 17800.
Here is an angular chart...
18000 seems to be the immediate top resistance, after which the move could continue with ups and downs till 22000, sometime in 2016.
Sunday, November 23, 2014
Nifty Astro Technicals for November 24 to 28, 2014
Last week we observed that the market is long term bullish and unless 8415 is taken out decisively with good volumes, we expect a downswing. There were several astro aspects which were pointing out to a negative outcome by way of a short term top...yet, Nifty after a fair period of consolidation, managed to move into positive territory by crossing 8415 decisively.
Interestingly all the square aspects of Venus with Jupiter, Sun with Jupiter, Mars with Rahu and Mars with Ketu, could only cause a prolonged consolidation for 11 days..in other words they could only cause a time effect and not a price effect. This phenomena happens once in a while, when there are other larger planets involved in the picture, causing bullishness. When the faster planets complete their formations, the larger planets take over.
See this chart....
 We can see that the market races up every time there is a Uranus Pluto square being formed.Magnitude of ensuing correction depends on the other planetary energies being manifested, after the Uranus Pluto square.Being slow moving planets affecting long term trends of all walks of humanity, when they are in aspect, smaller planetary aspects in the opposite direction will not be very effective. That is why so many related negative aspects could do little other than cause a pause and a consolidation ( that too a positive consolidation for 11 days!). The last formation is on March 17, 2015..which means the markets could be racing up for the grand finale then.( Curious to see that this phenomenal and rare formation begins with an 8, June 26 and ends with another 8, March 17.)
Which means after December 15, we could see some consolidation or reversal for the breath taking upmove so far.From December 04 onwards, smaller planets are also getting into positive mode, so from an astro point of view it is only buy on dips..No shorts whatsoever.
Technically,

Here is an updated chart of Neo wave counts, where I have also shown the cycle phenomena.
It is now confirmed that wave a of the 2nd x-abc formation is an impulse and is embarking on the 5th wave, Minimum target is 8600..this wave 5 inside a could show equality with wave 1 inside a, because wave 3 was an extended affair. In rare cases wave 5 also could extend apart from wave 3, but such an euphoric situation is not seen now. That could only happen when FIIs, DIIs and the retail investors all become buyers at the same time..which is obviously not the case yet.
Nifty has moved out of the upward channel which is a clear bullish sign.The trend will reverse as a correction when the final wave 5 is retraced in faster time and the x trendlines are pierced downwards.
Looking at the cycles, I have rounded all 23 day cycles which have shown inversions.We have just witnessed another one now. The cycle after the inversion has been seen to show a downward correction.
If we look at the 108 day cycle, we can see that it is forming a huge right translation.. This means the next cycle of 108 days will also probably be bullish to begin with.This also means that the corrections when they happen are going to be shallow affairs, till the cycle tops out. I have shown the cycle diagram as ending near 7600.This does not mean the market will come there. It is just a figurative representation of the cycle in operation.

Here is an expanded view of the present wave a of 2nd x abc.

The hourly chart also tells the same story..
Happy and profitable trading!
Interestingly all the square aspects of Venus with Jupiter, Sun with Jupiter, Mars with Rahu and Mars with Ketu, could only cause a prolonged consolidation for 11 days..in other words they could only cause a time effect and not a price effect. This phenomena happens once in a while, when there are other larger planets involved in the picture, causing bullishness. When the faster planets complete their formations, the larger planets take over.
See this chart....
Which means after December 15, we could see some consolidation or reversal for the breath taking upmove so far.From December 04 onwards, smaller planets are also getting into positive mode, so from an astro point of view it is only buy on dips..No shorts whatsoever.
Technically,
Here is an updated chart of Neo wave counts, where I have also shown the cycle phenomena.
It is now confirmed that wave a of the 2nd x-abc formation is an impulse and is embarking on the 5th wave, Minimum target is 8600..this wave 5 inside a could show equality with wave 1 inside a, because wave 3 was an extended affair. In rare cases wave 5 also could extend apart from wave 3, but such an euphoric situation is not seen now. That could only happen when FIIs, DIIs and the retail investors all become buyers at the same time..which is obviously not the case yet.
Nifty has moved out of the upward channel which is a clear bullish sign.The trend will reverse as a correction when the final wave 5 is retraced in faster time and the x trendlines are pierced downwards.
Looking at the cycles, I have rounded all 23 day cycles which have shown inversions.We have just witnessed another one now. The cycle after the inversion has been seen to show a downward correction.
If we look at the 108 day cycle, we can see that it is forming a huge right translation.. This means the next cycle of 108 days will also probably be bullish to begin with.This also means that the corrections when they happen are going to be shallow affairs, till the cycle tops out. I have shown the cycle diagram as ending near 7600.This does not mean the market will come there. It is just a figurative representation of the cycle in operation.

Here is an expanded view of the present wave a of 2nd x abc.
The hourly chart also tells the same story..
Happy and profitable trading!
Tuesday, November 18, 2014
Mars in Sagittarius-across the years
Gann gave a lot of importance to the movements of Mars-he considered it as a market planet.He refers to Mars as the "Key" to market moves in the short term.
So what was the market effect when Mars was in Sagittarius, over the years. I have compiled some observations based on Nifty movements.

 In 2003, we did not see any significant bottom formation, that actually shifted to Capricorn. So something has changed.Let us see the astro charts...

Which is the closest planet to Mars? It is Pluto. Being a heavy weight planet, it has started influencing Mars.


So what was the market effect when Mars was in Sagittarius, over the years. I have compiled some observations based on Nifty movements.
I have clubbed together the years Mars was in Sagittarius-1996 to 2001 into one chart here. We see that in those years every visit of Mars in Sagittarius was seen to cause a significant drop or bottom formation.In the initial years there used to be a secondary bottom when Mars was in Capricorn or Aquarius but in later years, after Mars left Sagittarius, we see significant recoveries happening. Important thing here is significant bottom formation in Sagittarius.
Which is the closest planet to Mars? It is Pluto. Being a heavy weight planet, it has started influencing Mars.
In 2005, we see a bottom formation before Mars enters Sagittarius and then towards the period Mars is about to leave Sagi, there is another reversal. This time Pluto is only minutes apart, when Mars enters Sagittarius.
Aha! Transformation! Mars is meeting Pluto in Sagittarius. Since Pluto is such a slow moving Planet, its move into Sagittarius from Scorpio. is a massive shift..several new trends are getting set up here.In hindsight we know that all subprime was about to boil over in a year`s time!
Anyway the trend is that we get a bottom when Mars enters Sagittarius and also a smaller top when is is closer to the exit from Sagi.
Here the regular pattern has got hugely distorted by the "crowd" in Sagittarius and Capricorn..an important lesson for us as to what happens to trends when there is overcrowding of planets with different kinds if energy all jostling together.Still we see a dominant trend of reversal closer to Mars exiting Sagittarius.
In 2010, we are back to the old pattern..A bottom formation just prior to Mars in Sagi, followed by an uptrend and then a beak down closer to Mars exiting Sagi.

And in 2012, nothing much has changed..Two bottoms one prior and one after Mars in Sagi, then a rise and importantly, a drop just before Mars leaves Sagi...
And now in 2014...
True to form we had a bottom just before Mars entered Sagi, on October 17th, and then a spectacular rise.Most consistent has been that there be a reversal before Mars exits Sagittarius...There are 8 more trading days before Mars exits Sagi...
Will there be a fall? You judge!There are enough other astro reasons as shown above....
Subscribe to:
Posts (Atom)